
Overview
This tutorial walks through deploying the Elastic Stack on Azure Kubernetes Service (AKS) using a CI/CD-driven, infrastructure-as-code approach. Elasticsearch, Kibana, and Elastic Fleet Server are deployed using Elastic Cloud on Kubernetes (ECK), with Kubernetes metrics and logs collected via Elastic Agent running in Fleet mode. The deployment is driven by an Azure DevOps pipeline, which installs the ECK Operator via Helm and applies all Elastic resources through declarative Kubernetes manifests, eliminating the need for manual setup or ad-hoc kubectl commands at the infrastructure layer.
By the end of this guide, you’ll have a fully integrated observability stack where Elastic Agents self-enroll with Fleet, and all ongoing configuration, such as Kubernetes metrics, log collection, and agent policies, is managed centrally through the Kibana UI.
What this tutorial configures:
-
Deployment of the Elastic Cloud on Kubernetes (ECK) Operator using Helm from an Azure DevOps CI/CD pipeline
-
Provisioning of Elasticsearch and Kibana via Kubernetes custom resources
-
Exposure of Kibana through Azure Application Gateway Ingress
-
Deployment of Elastic Agent in Fleet mode with Fleet Server enabled
-
Automatic agent self-enrollment without manual enrollment tokens
-
Centralized management of agent policies and integrations through the Kibana Fleet UI
-
Collection of Kubernetes metrics and container logs using Elastic’s Kubernetes integration
-
A repeatable, declarative workflow where CI/CD enforces infrastructure state and Fleet manages observability configuration
Creating a pipeline in Azure Devops
Starting configuration
Within the Azure Devops project, the pipelines section is where the pipeline will be built. Start the process of creating a new pipeline.
Select Git Repository
Within Select the repository where the code is being used. In this example Github is being used and Azure Devops will be able to pull the code and save the pipeline configuration to the repository. After the Git connected, it will ask which repository to use for the project. 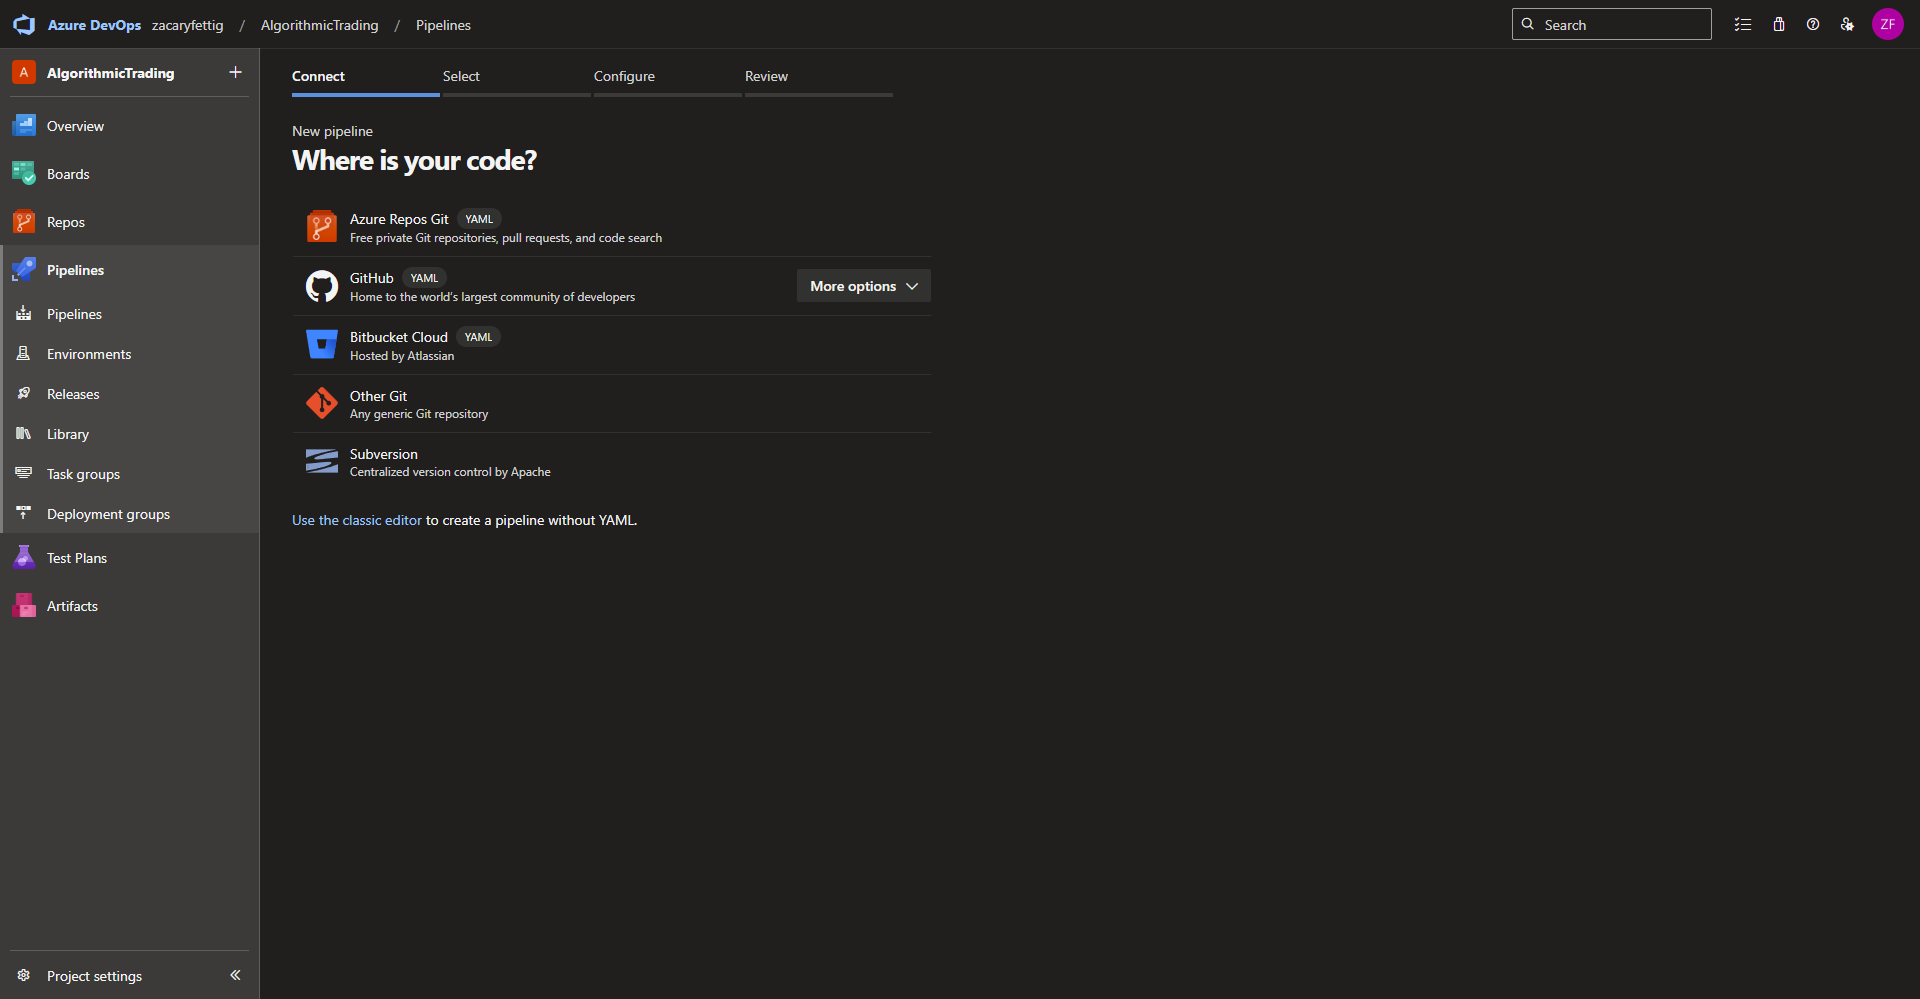
Specifying new or existing pipeline file
On the configure your pipeline page, select starter pipeline for a new pipeline or existing if there is already a pipeline yaml file within your repository that will be used for this pipeline. 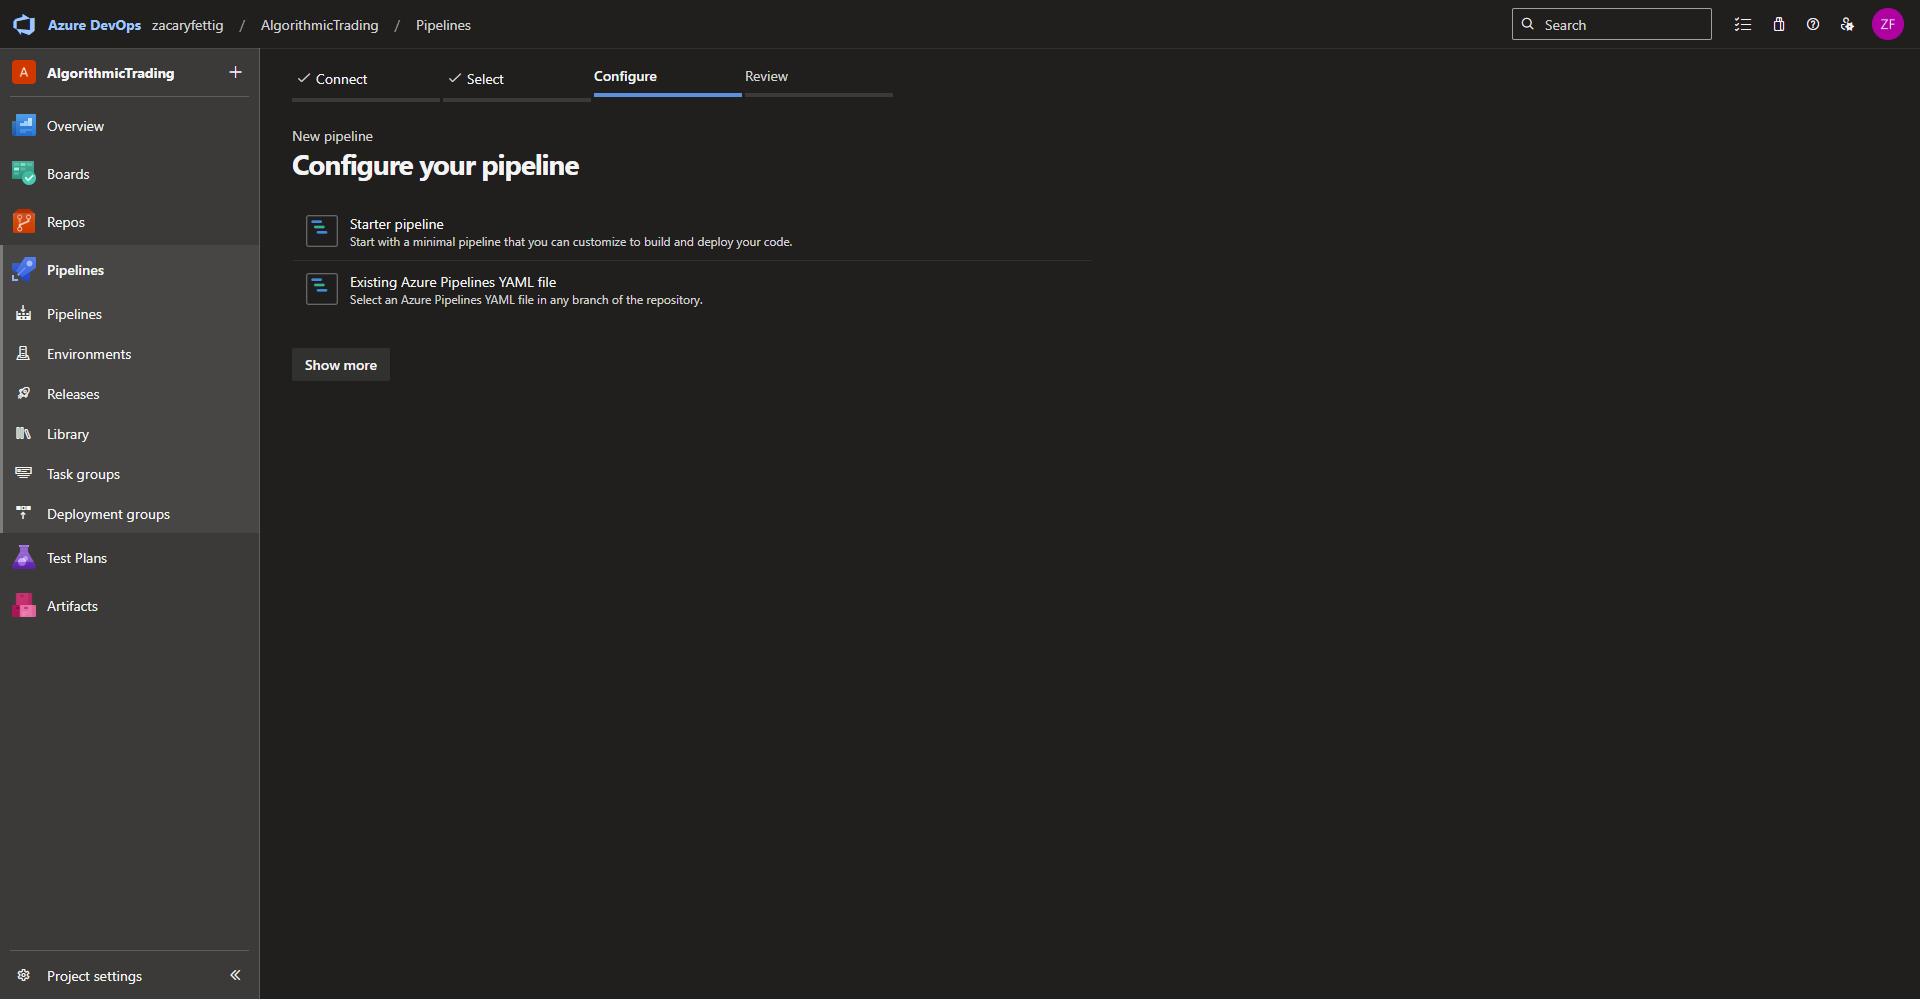
Completing the setup
Now the pipeline file can be edited, saved, or ran for the first time. 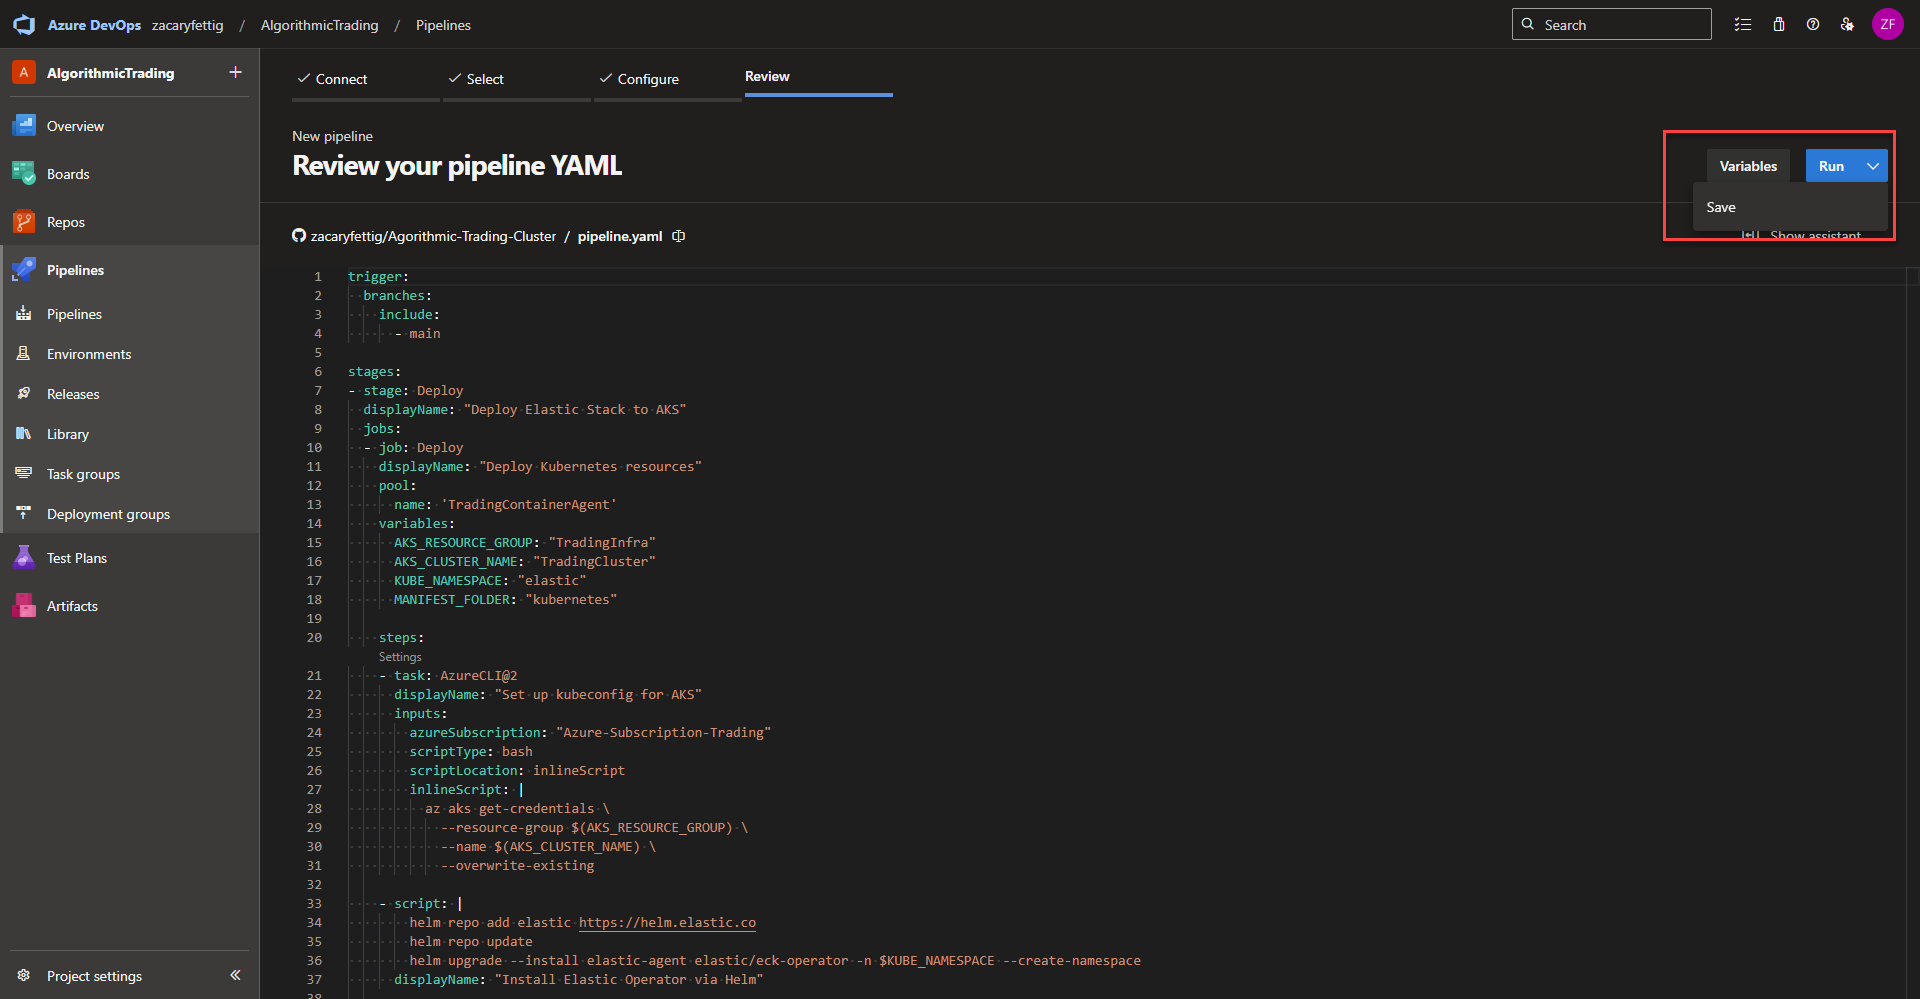
Development of the Elastic Pipeline Code
This Azure DevOps pipeline automates the deployment of the Elastic Stack into an Azure AKS Cluster.
Summery of events:
-
Triggers on changes to the main branch
-
Connects securely to AKS
-
Installs the Elastic Cloud on Kubernetes (ECK) Operator using Helm
-
Deploys Elasticsearch, Kibana, Fleet Server, and integrations using Kubernetes YAML manifests
Pipeline Trigger
This tells the pipeline when to run. Azure DevOps monitors the main branch of the repository that was configured for the pipeline. Any commit or merge into main automatically triggers the pipeline.
trigger:
  branches:
    include:
      - main
Stages | Agent Pool Selection | pipline variables
Stages and jobs – A stage is used when grouping major milestones in the pipeline. For example, Staging, Production deployment, Testing. Jobs group steps within that stage. Jobs can be run in parallel where stages run one after the other. The code below defines the stage and the first job for deploying Kubernetes resources
Pool – Specifies which agent pool runs the job (Self Hosted Agent Pool or Microsoft Managed Pool). Add the agent pool name here as configured in the Azure Devops Project Settings Page > Piplines > Agent pools.
variables – Section dedicated to defining variables that are used throughout the pipeline file.
Variables used:
-
AKS_RESOURCE_GROUP: Name of the resource group that has access to connect the AKS Resources.
-
AKS_CLUSTER_NAME: Name of the AKS Cluster
- KUBE_NAMESPACE: Kubernetes Namespace the Elastic Resources will get applied.
- MANIFEST_FOLDER: The folder within the code repository where the Kubernetes Yaml files live. Nested folders can be defined like ./kubernetes/api
stages:
- stage: Deploy
  displayName: "Deploy Elastic Stack to AKS"
  jobs:
  - job: Deploy
    displayName: "Deploy Kubernetes resources"
    pool:
      name: 'TradingContainerAgent'
    variables:
      AKS_RESOURCE_GROUP: "TradingInfra"
      AKS_CLUSTER_NAME: "TradingCluster"
      KUBE_NAMESPACE: "elastic"
      MANIFEST_FOLDER: "kubernetes"
Authenticate with Kubernetes
Runs the CLI command to add the credentials to the kubeconfig used to authenticate with Kubernetes. A AzureCLI@2 task authenticates to Azure using a preconfigured service connection and executes CLI commands in that context. Once this is done kubectl and helm commands can communicate with the cluster.
    steps:
    - task: AzureCLI@2
      displayName: "Set up kubeconfig for AKS"
      inputs:
        azureSubscription: "Azure-Subscription-Trading"
        scriptType: bash
        scriptLocation: inlineScript
        inlineScript: |
          az aks get-credentials \
            --resource-group $(AKS_RESOURCE_GROUP) \
            --name $(AKS_CLUSTER_NAME) \
            --overwrite-existing
Install ECK Operator – The ECK Operator handles scaling, upgrading, and lifecycle management of the of Elastic Stack components. This section of code adds the official Elastic Elastic Helm Repo if it isn’t already installed. Updates the repository with the newest releases if already added. Installs the ECK Operator.
    - script: |
        helm repo add elastic https://helm.elastic.co
        helm repo update
        helm upgrade --install elastic-agent elastic/eck-operator -n $KUBE_NAMESPACE --create-namespace
      displayName: "Install Elastic Operator via Helm"
Apply Kubernetes YAML – Applies all Kubernetes yaml manifests from the repository folder specified in the variable. The yaml files in this project apply Elastic Search, Kibana, Elastic Feet Agent, and ingress configuration.
    - script: |
        kubectl apply -f $(MANIFEST_FOLDER)
      displayName: "Deploy all Kubernetes YAML manifests"
YAML Files for Elastic Stack
Elastic Search – A search and analytics engine designed to store, search, and analyze data very quickly. ES is well known for it’s ability to optimize for quick querying of data in real time. The yaml below shows how to create ES within Kubernetes. The yaml defines the desired state and hands it off to the ECK Controller to create the entire application at the time of deployment.
Sections within the code:
- kind: Tells the cluster that its creating Elastic Search.
- version: Specifies the Elastic Search Application version to install.
- nodeSets: Defines the amount of Statefulset’s deployed on the nodes. Count of two would deploy two Statefulset’s on each node.
- volumes: A blank volume is created to mount persistent storage and is set as emptyDir in the config that is later overwritten by ECK.
- volumeClaimTemplates: The section creates a persistent volume claim with access mode of ReadWriteOnce and 50Gi of storage. Elastic Search is where the log/metric data is stored and the initial storage size can be increased here.
---
apiVersion: elasticsearch.k8s.elastic.co/v1
kind: Elasticsearch
metadata:
  name: elasticsearch
  namespace: elastic
spec:
  version: 8.16.0
  nodeSets:
    - name: default
      count: 1
      config:
        node.store.allow_mmap: false
      podTemplate:
        spec:
          volumes:
            - name: elasticsearch-data
              emptyDir: {}
      volumeClaimTemplates:
        - metadata:
            name: elasticsearch-data
          spec:
            accessModes: ["ReadWriteOnce"]
            resources:
              requests:
                storage: 50Gi
            storageClassName: default
Kibana – Deploying the web interface for data visualization and web interface for log/metrics search. The majority of time spent after application deployment is spent in the Kibana Web UI.
Sections within the code:
- kind: Tells the cluster that its creating Kibana.
- version: Specifies the application version to install.
- Count: Number of pods that Kibana runs on.
- elasticsearchRef: Connects Kibana to elastic search. The name must be the same name as the Elastic Search metadata name in the Elastic Search yaml. This section automatically handles the connection details, certificates, and credentials in the behind the scenes wiring.
- service: Creates a ClusterIP service to expose the Kibana Web Interface outside of the Pod.
- xpack.fleet.enabled: Turns on fleet for centralized managment of Elastic Agents. Gives the capability to enroll agents, assign policies, manage integrations, and monitor agent health within the Kibana UI.
- expack.fleet.agents.fleet_server.hosts: Tells the Elastic Agents where to find the fleet server using the internal service name.
- xpack.fleet.agents.elasticsearch.hosts: Tells the Elastic Agents where Elastic Search is located and which endpoint to send collected data to.
---
apiVersion: kibana.k8s.elastic.co/v1
kind: Kibana
metadata:
  name: kibana
  namespace: elastic
spec:
  version: 8.16.0
  count: 1

  elasticsearchRef:
    name: elasticsearch

  http:
    service:
      spec:
        type: ClusterIP

  config:
    xpack.fleet.enabled: true
    xpack.fleet.agents.fleet_server.hosts:
      - http://kibana-kb-http.elastic.svc:5601
    xpack.fleet.agents.elasticsearch.hosts:
      - https://elasticsearch-es-http.elastic.svc:9200
Fleet Server – The central management controller for Elastic Agents for agent enrollment, policy distribution, agent status tracking. The Fleet Server doesn’t collect logs/metrics itself, but acts the the controller for the agents that are tasked with that job.
Sections within the code:
- kind: Tells the cluster that its creating an Agent.
- version: Specifies the application version to install.
- mode: Tells the Elastic Agent that it’s tied to fleet for centralized management and Kibana based configuration, policies, and integrations.
- FleetServerEnabled: The specified value set to true tells the configuration to mark it as the Fleet Server.
- ElasticsearchRefs: Links the Fleet Server to Elastic Search
- KibanaRef: Links the Fleet Server to Kibana.
- Deployment: Number of pods that the Fleet Server runs on.
---
apiVersion: agent.k8s.elastic.co/v1alpha1
kind: Agent
metadata:
  name: fleetserver
  namespace: elastic
spec:
  version: 8.16.0
  mode: fleet
  fleetServerEnabled: true
  elasticsearchRefs:
  - name: elasticsearch
  kibanaRef:
    name: kibana

  deployment:
    replicas: 1
Monitoring Agent – As explained previously, the helper function defines the blueprint for creating a resource group. The function maps the input parameters like the name used for the resource group and the location and adds them to the resource configuration.
Sections within the code:
- kind: Tells the cluster that its creating an Agent.
- version: Specifies the application version to install.
- mode: Tells the Elastic Agent that it’s tied to fleet for centralized management and Kibana based configuration, policies, and integrations.
- policyID: The policy the agent is using. The policy is defined in Kibana and this section links the agent to the policy.
- FleetServerEnabled: The value set to false specifies that this Agent is a regular monitoring agent and not a Fleet Server.
- DaemonSet: Running the agent as a DaemonSet where one agent runs on every node allowing for deep exploration of metrics/logs on each node.
- serviceAccountName: The service account that the agent uses to allow permissions on getting metrics/logs from the cluster.
- KibanaRef: Connects the agent to Kibana
- FleetServerRef: Connects the agent to the Fleet Server.
---
apiVersion: agent.k8s.elastic.co/v1alpha1
kind: Agent
metadata:
  name: elastic-agent
  namespace: elastic
spec:
  version: 8.16.0
  mode: fleet
  policyID: fleet-server-policy

  fleetServerEnabled: false
  daemonSet:
    podTemplate:
      spec:
        serviceAccountName: elastic-agent

  kibanaRef:
    name: kibana
    namespace: elastic

  fleetServerRef:
    name: fleetserver
    namespace: elastic
Add to repository – Add these yaml config files into a folder within your Git Repository so that they can be deployed out through Azure Devops. I am storing the yaml files within the Kubernetes folder of my Github root so that any yaml files within the Kubernetes folder will get deployed out within the pipeline.
YAML Files Ingress Configuration
Ingress – Creates an Ingress file that directs traffic from internal exposed pod service to Azure Application Gateway.
---
apiVersion: networking.k8s.io/v1
kind: Ingress
metadata:
  name: kibana-ingress
  namespace: elastic
  annotations:
    appgw.ingress.kubernetes.io/backend-protocol: "http"
    appgw.ingress.kubernetes.io/backend-hostname: "kibana-kb-http.elastic.svc.cluster.local"
    appgw.ingress.kubernetes.io/backend-path-prefix: "/"
    appgw.ingress.kubernetes.io/probe-path: "/api/status"
spec:
  ingressClassName: azure-application-gateway
  rules:
    - http:
        paths:
          - path: /
            pathType: Prefix
            backend:
              service:
                name: kibana-kb-http
                port:
                  number: 5601
Deploying Azure Devops Pipline
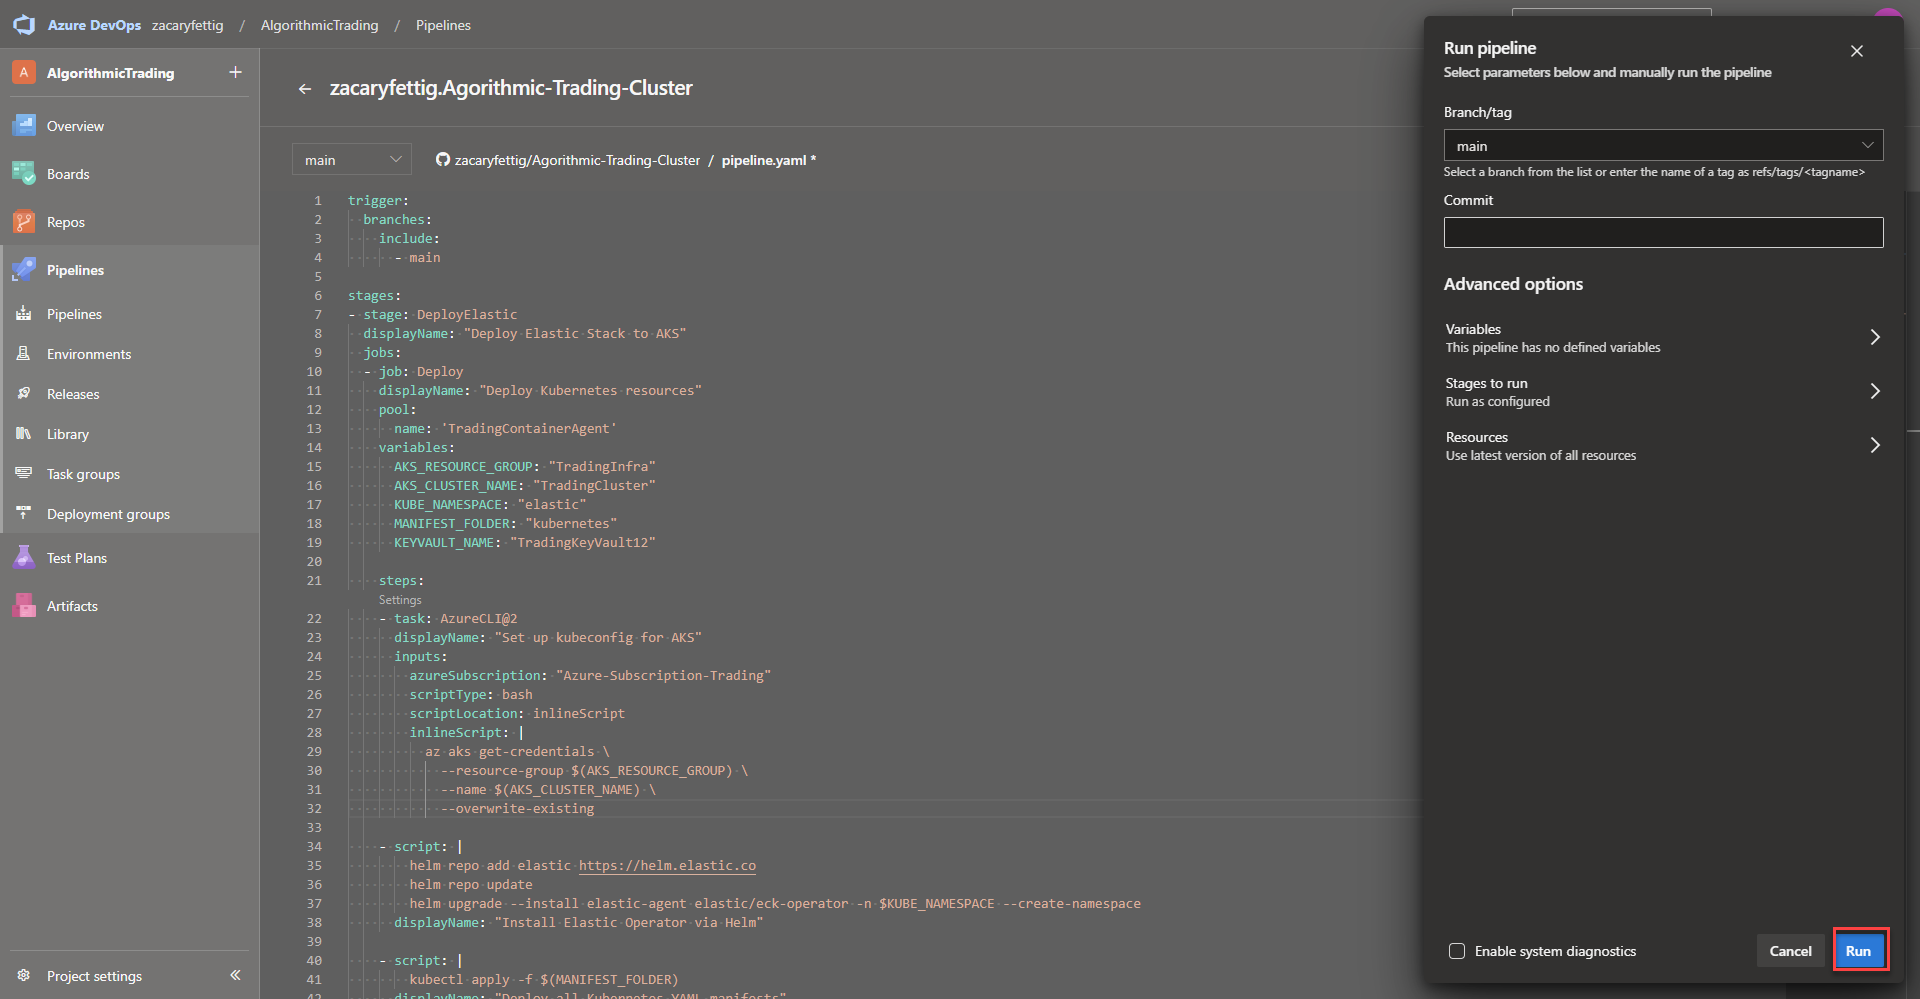
Running the pipeline – To Kick off the deployment, select run from the to right side of the pipeline editing page. Select Run again once the pop up window appears. 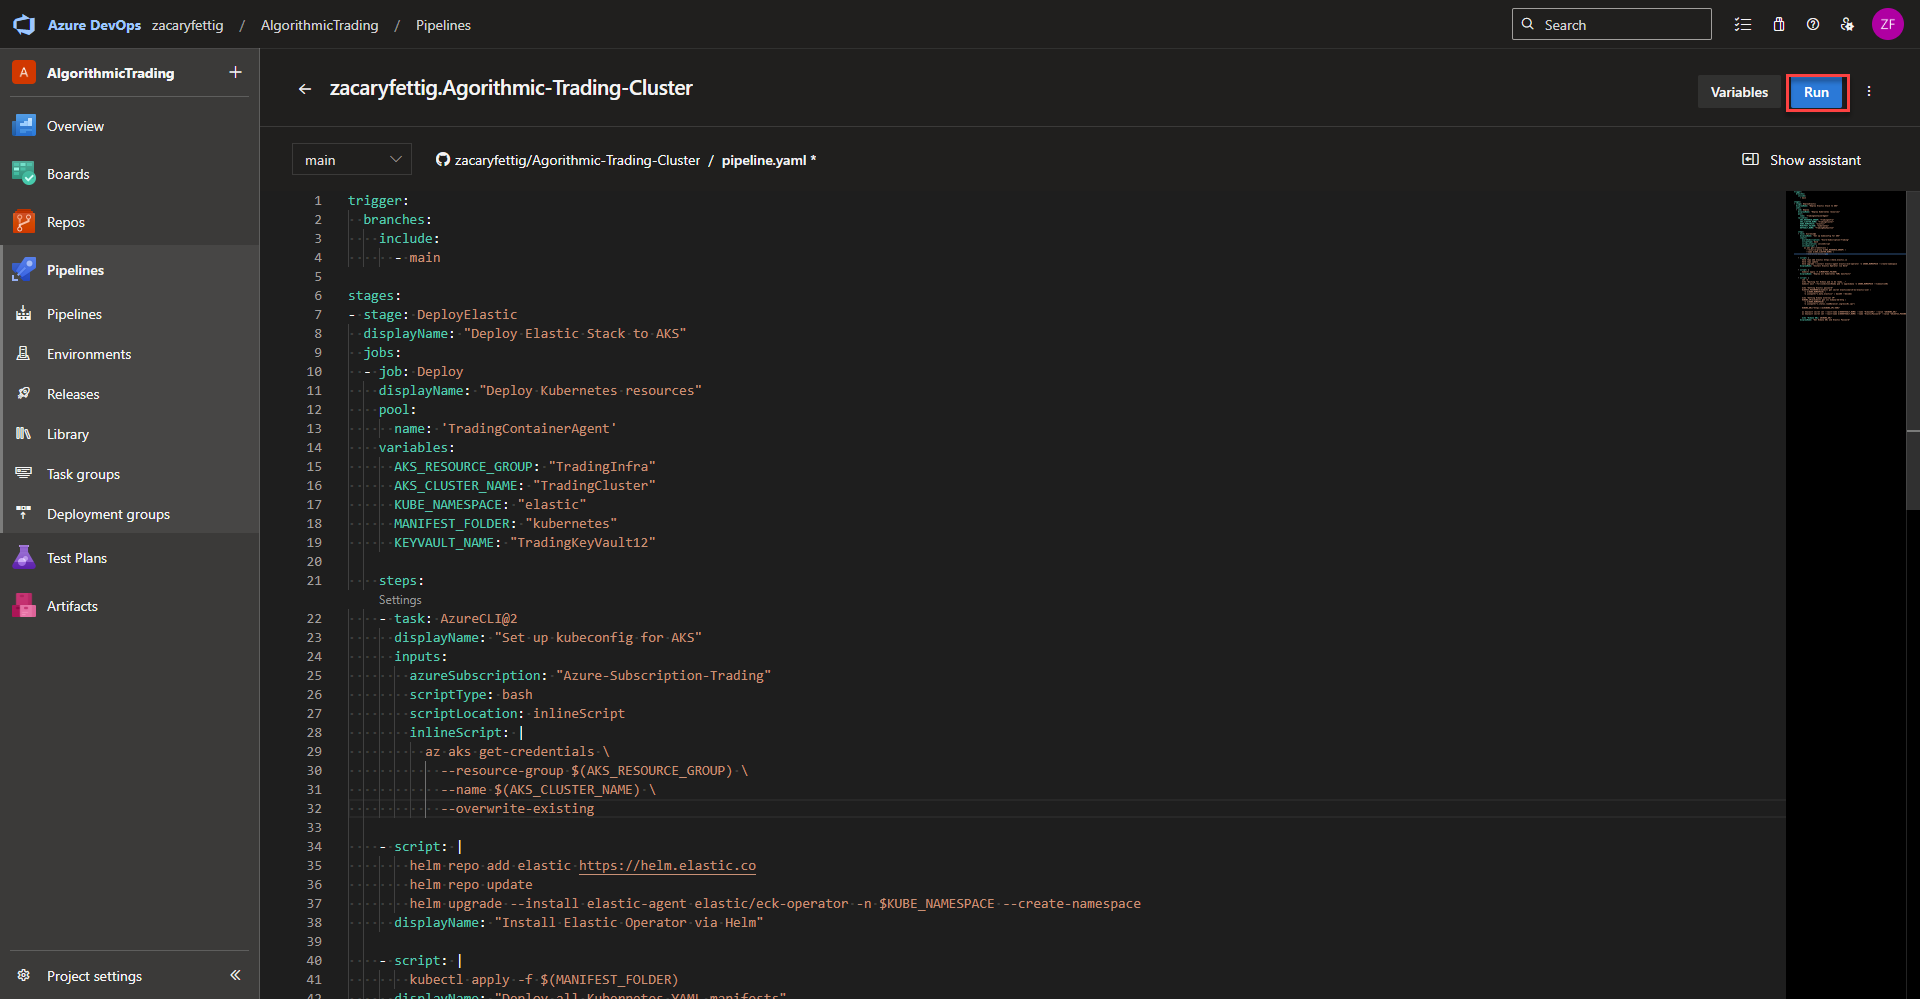
Viewing pipline details – Azure Devops will automatically redirect to to the progress page to show the running pipeline. In the stages section click on the in progress stage to see the details on what is currently being worked on.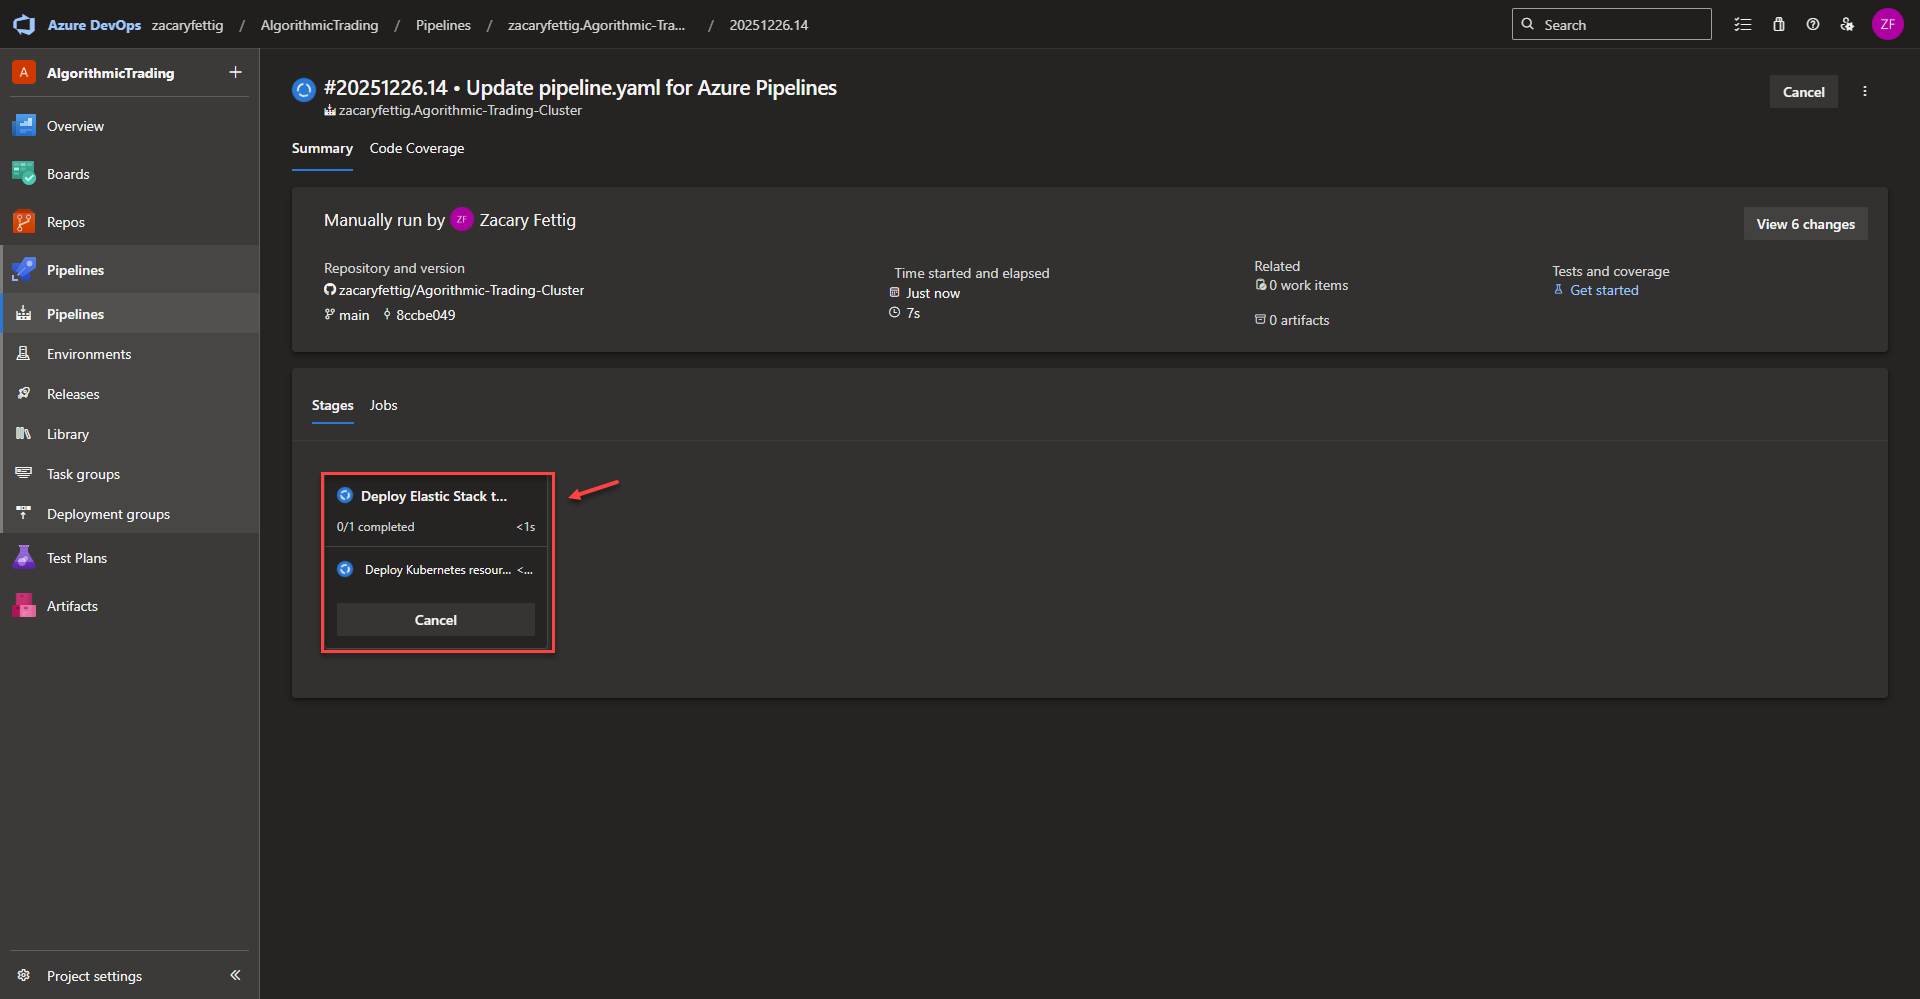
Azure Completing Jobs – The pipeline will run through all of the jobs and show a green check mark upon successful completion. It will notify and show the logs of any errors that cause the pipeline to fail which can directly be used for troubleshooting. Once this runs successfully, all of the required resources for monitoring the cluster with Elastic will have been deployed. 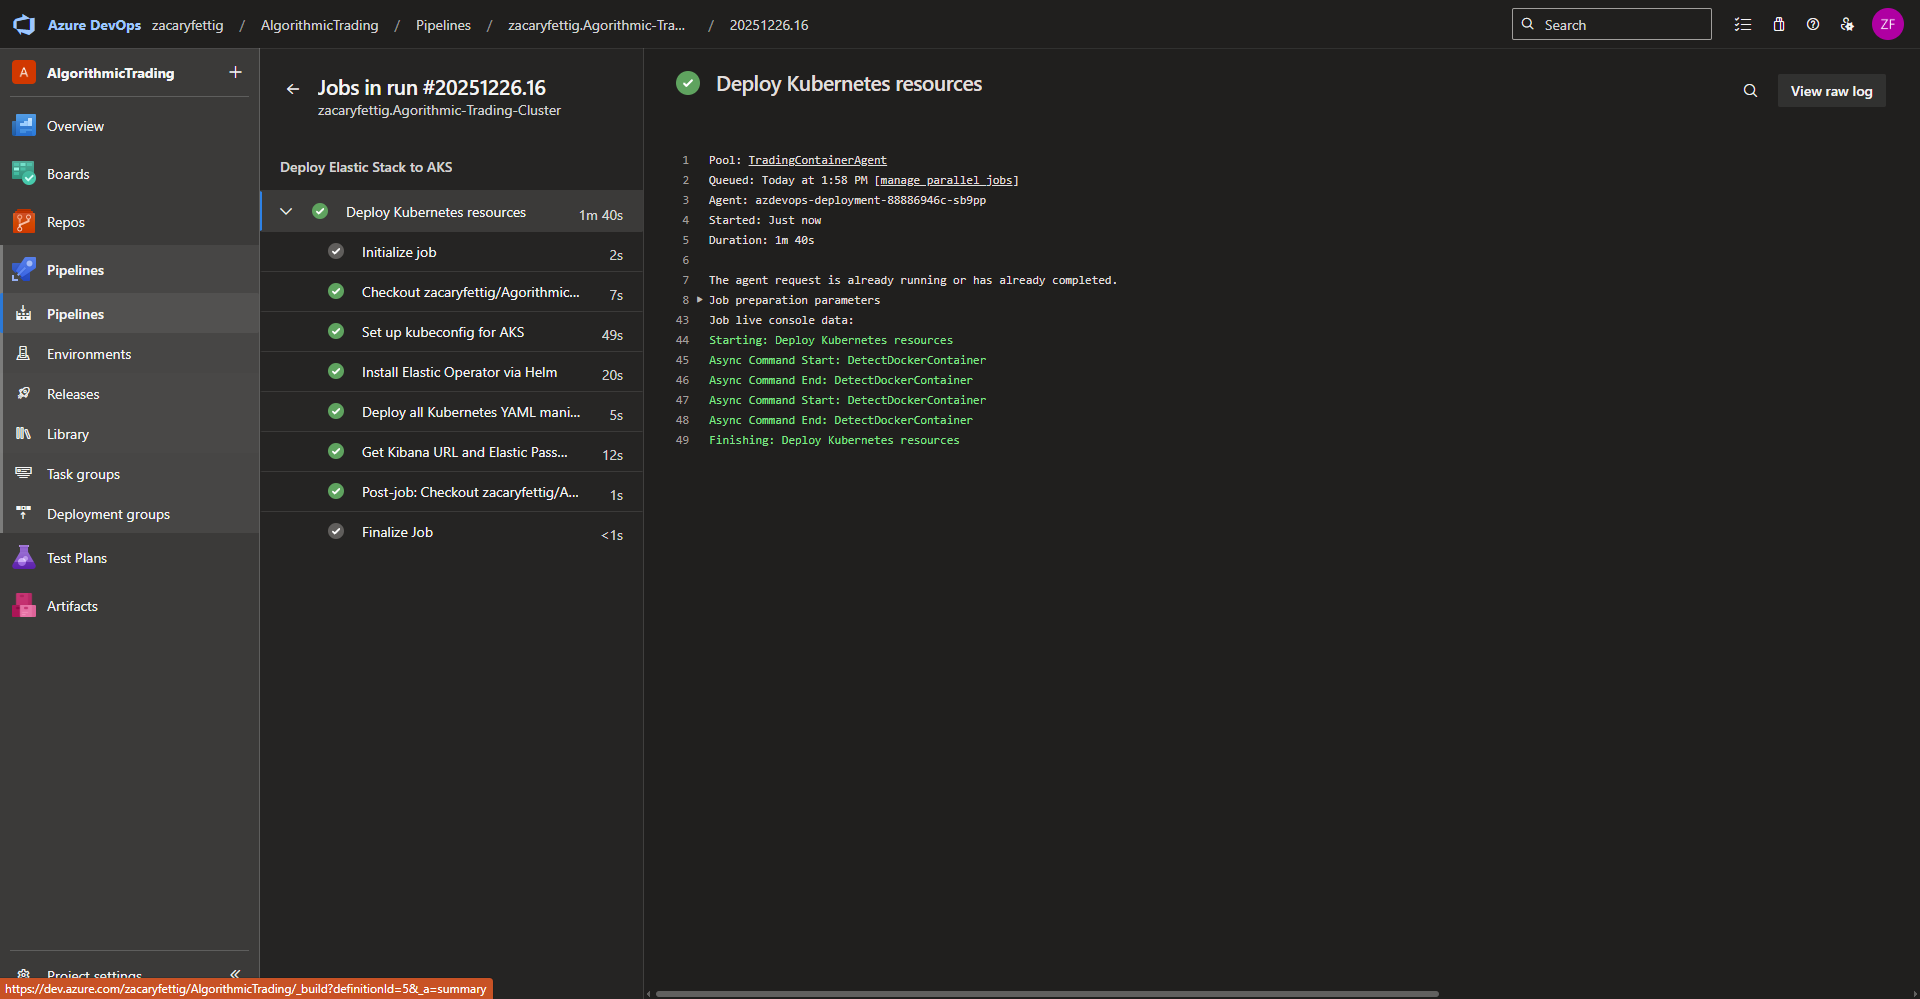
Final Kibana UI Configuration
Login – Open the Kibana Web Ui using the IP of the Azure Application Gateway Public IP. Use the kubectl command below to get the Elastic password from the Kubernetes secret to login. The default username is elastic.
kubectl get secret elasticsearch-es-elastic-user -n elastic \
  -o go-template='{{.data.elastic | base64decode}} ' ; echo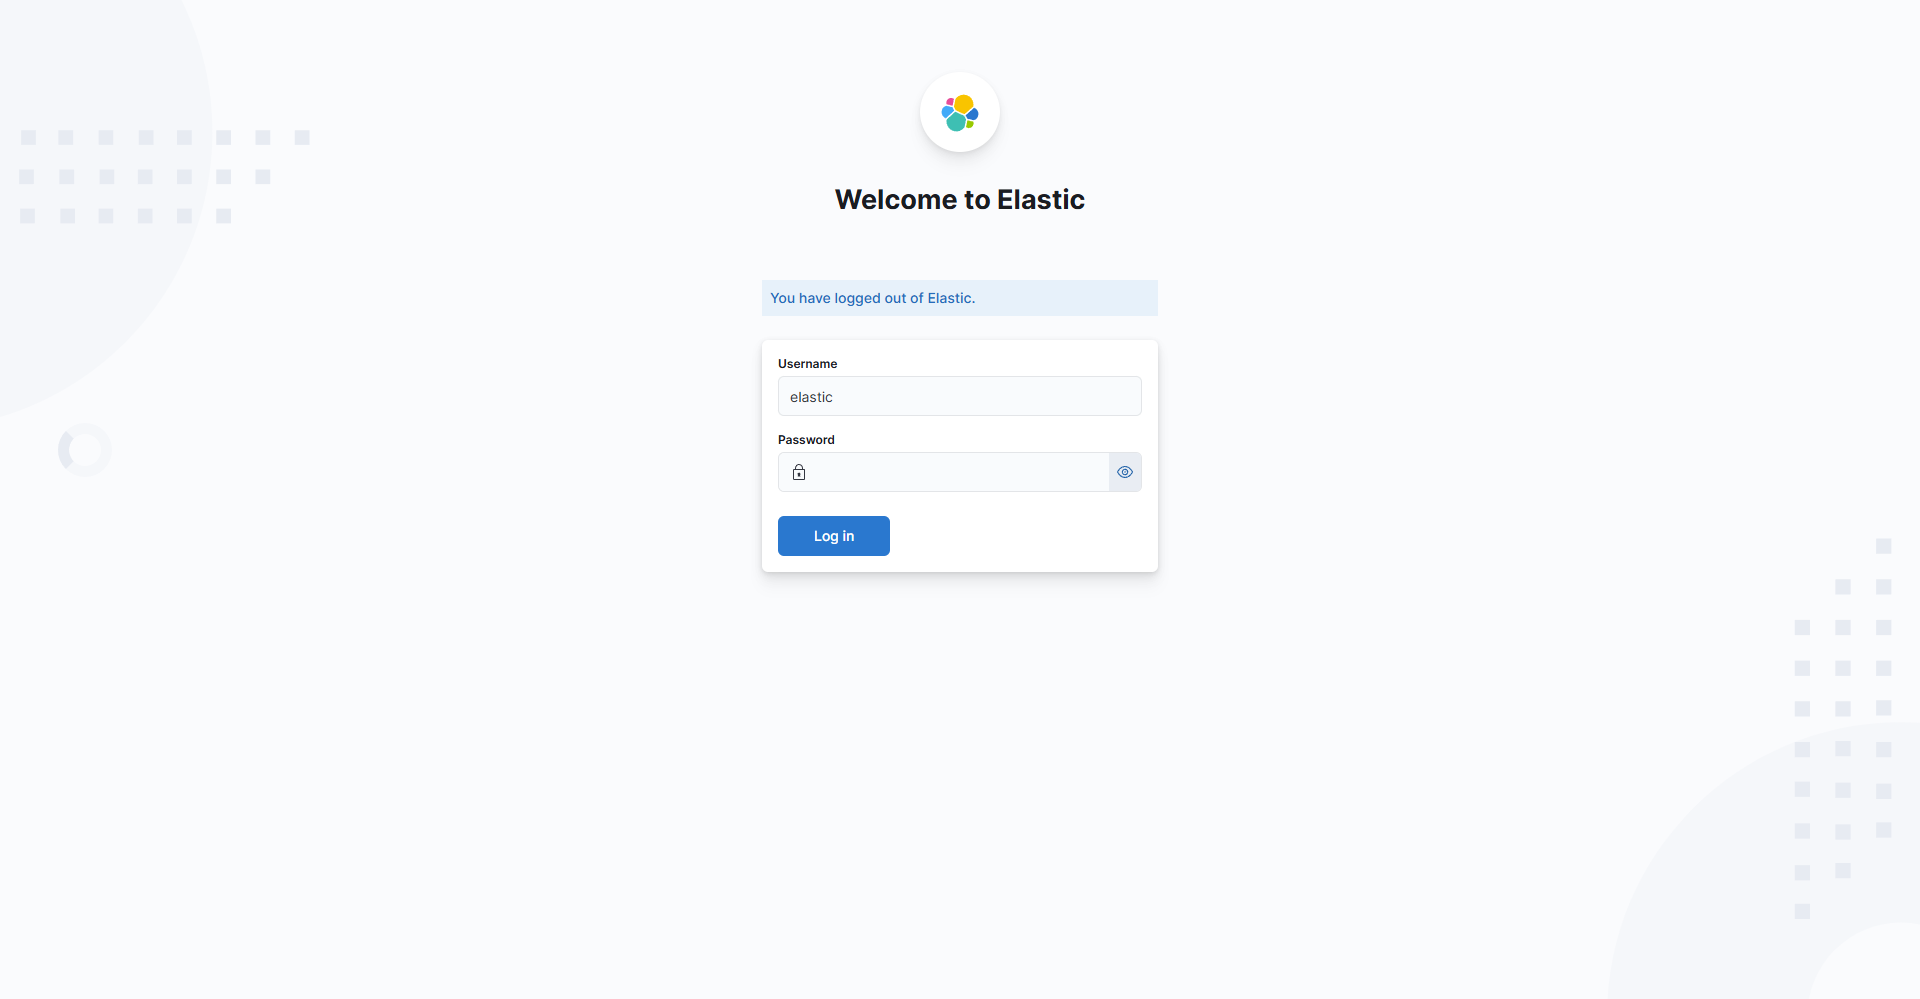
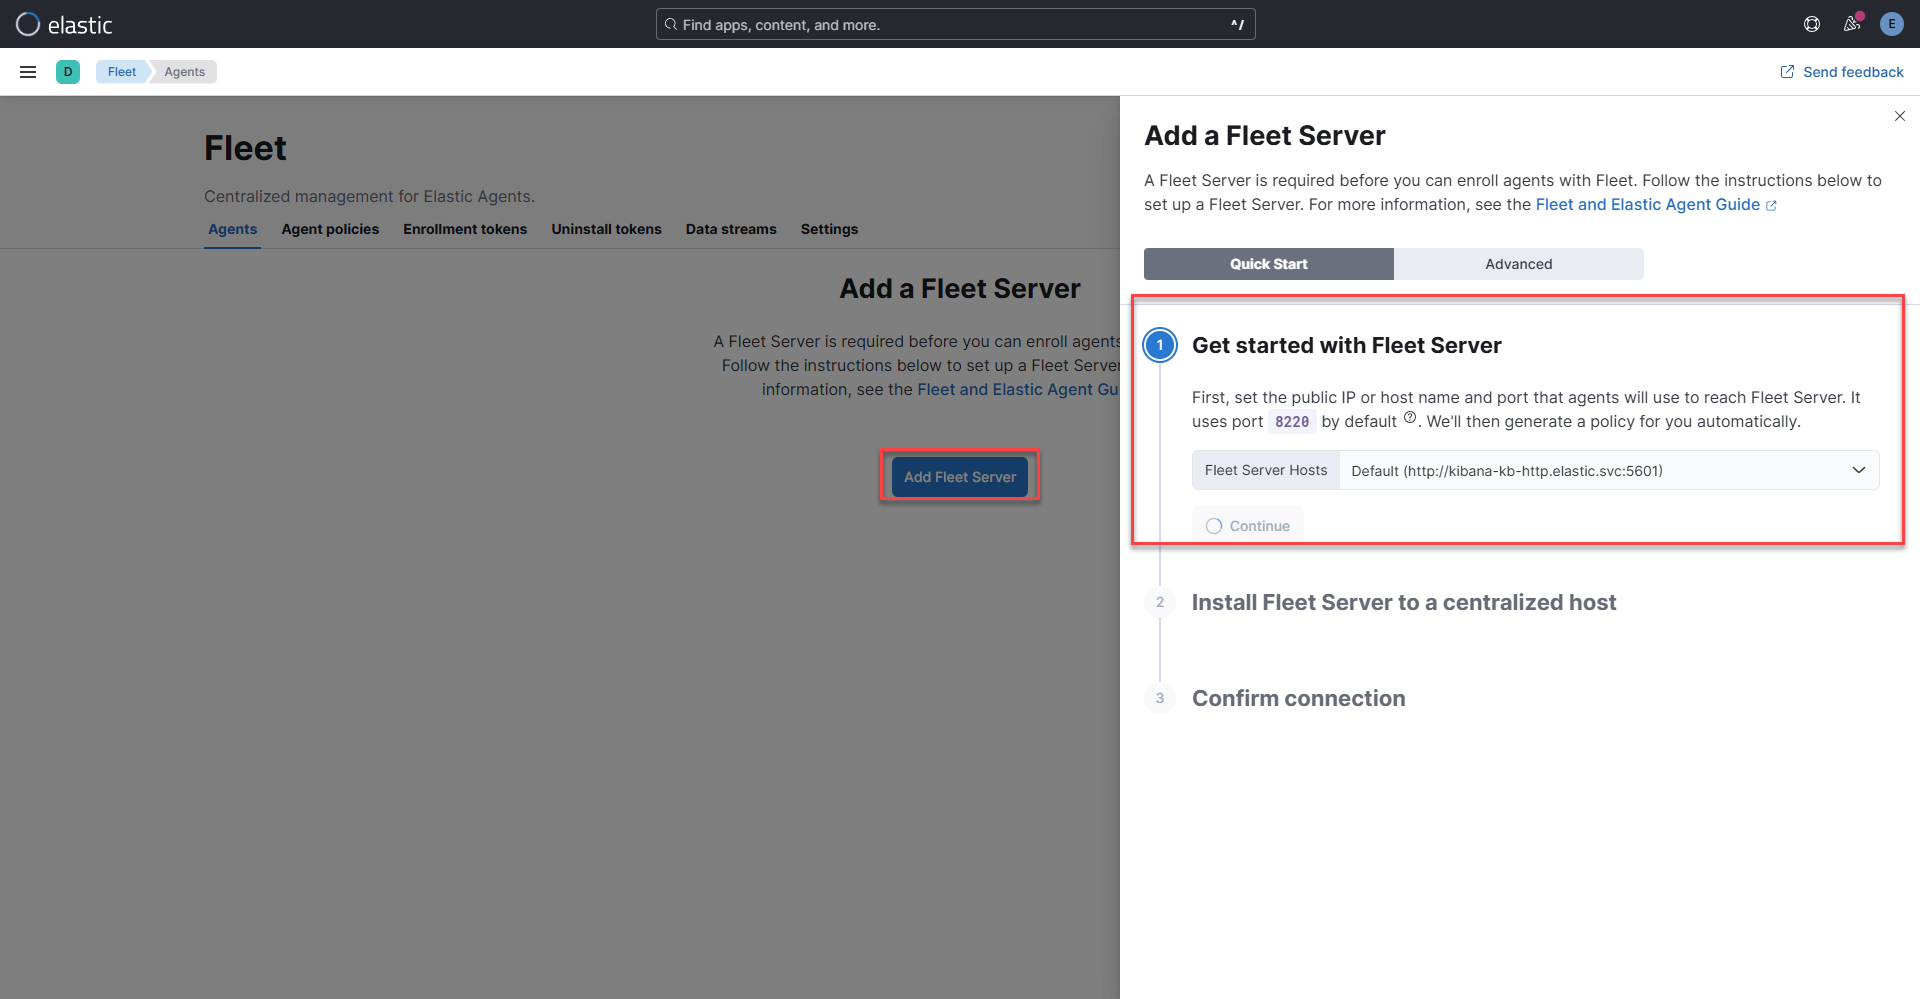
Generating the default Fleet Policy – Navigating to the fleet page from the left hand side bar, select add Fleet Server. Select Continue under step 1 to create the default agent policy. The agents applied through the Kubernetes YAML file will then be able to sync up to the default policy. Including the internal agent that handles Fleet Server’s own communication telemetry, and management tasks. If desired later on, the agents can then be moved to a different policy later on in the UI, but require the default policy to connect without extra cli configuration. Close the Add a Fleet Server wizard window and wait a couple of minutes for the agent to come online.
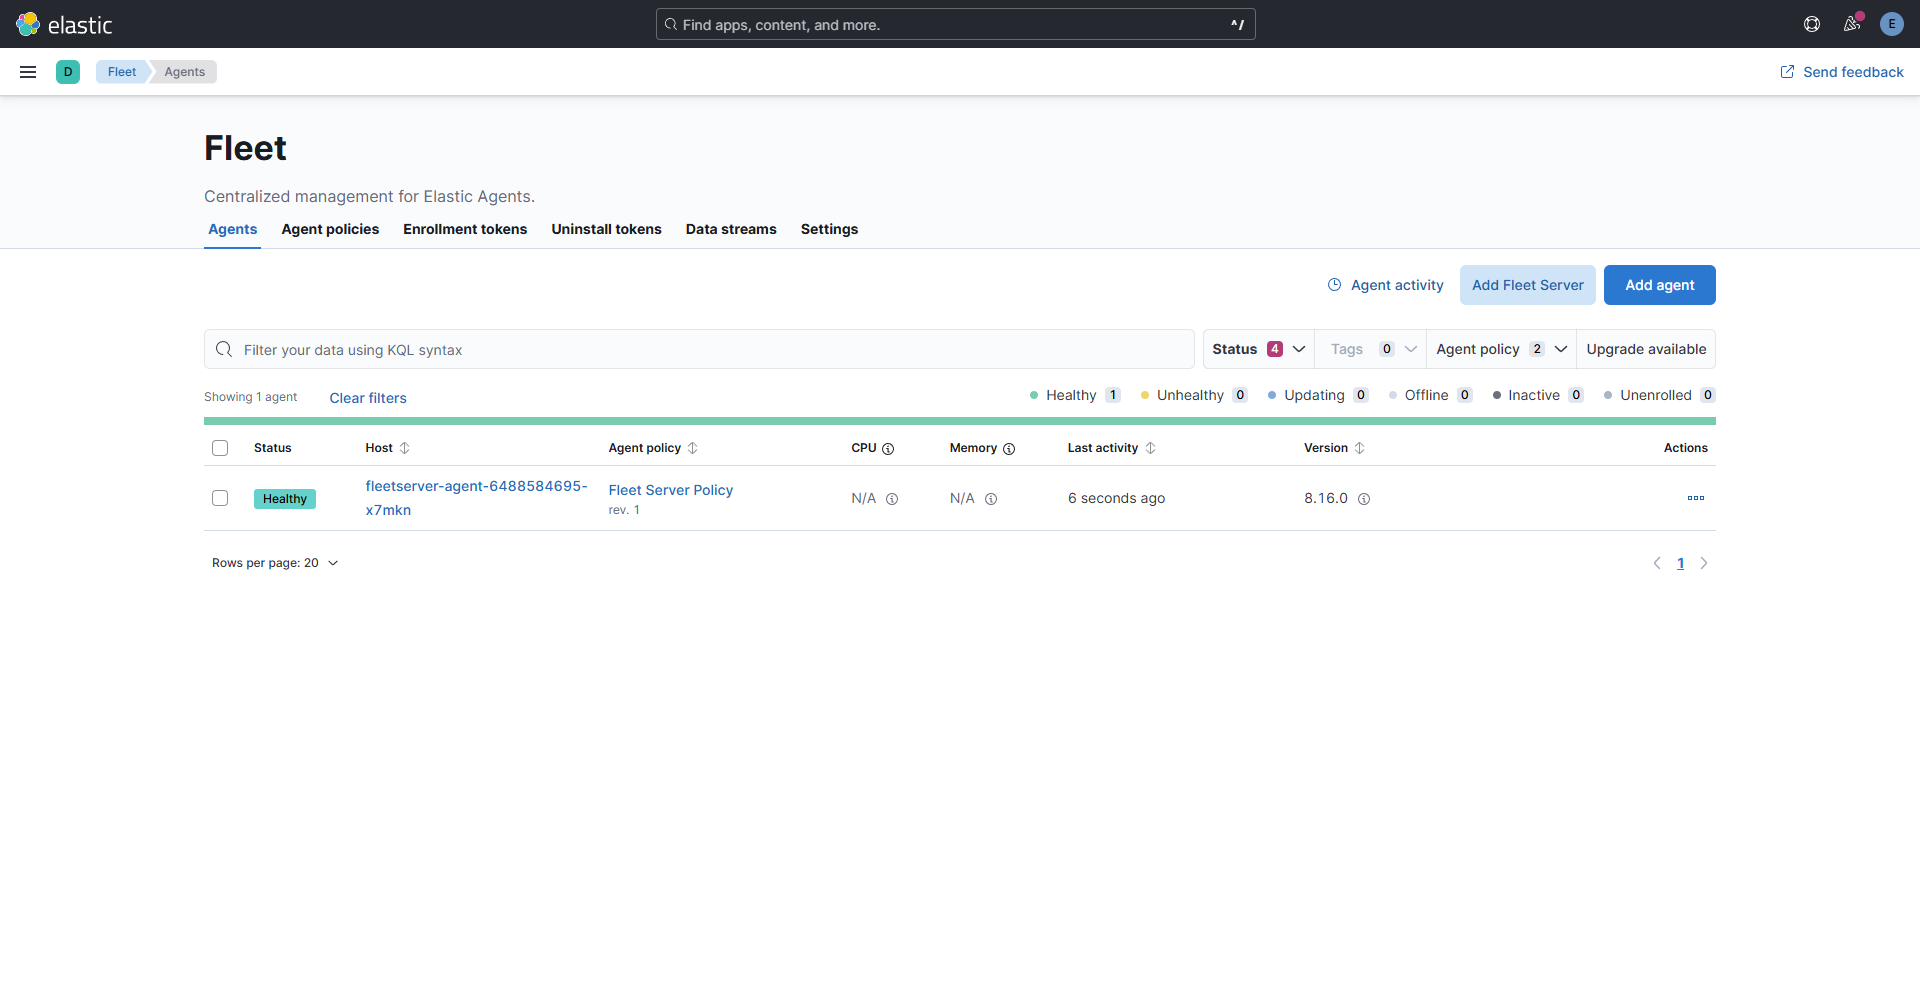
Fleet Agent – After a couple of minutes the Fleet Server Agent will associate with the policy and automatically appear in the UI.
Metrics and Logging within Kibana
This section is still being documented. Check back later to see how the to collect and view metrics and logs.